
I know that not many days go by with some post on how warm Grand Rapids has gotten on one or more days. And in the winter time there are also many days of how much snow has or will fall or how cold it has or will become. So l thought it would be a good idea to see 1 what is the average annual number of days Grand Rapids has had (averaged out over the 30 year period of 1981 to 2010) and 2. just what the average is for each month in the current 30 year period and the older period of 1971 to 2000. And then see what the average is at the last 15 years (to get a hint of the next 30-year average) I know most climate scientists like the 30 period but there are some who are pushing for a 10 or 15 year period. I think there should be the 30 period and a longer 50 and or 100-year period for a longer time frame.
Ok now just for the fun of it here is the average annual number of days Grand Rapids has had for some milestone temperatures. In the current 30 average period (1891/2010) the annual average of 100° days is 0.77 (that is less than 1 per year) for 90° days the average is 8.4 So far 2018 has had 5 so we are off to a good start. Note some sites list the average number of 90 days at Grand Rapids as 10. The annual average number of days at or above 50 is 226.3 the number of days where the high is 32 or lower is 47.3 the average number of days with the low of 32 or colder is 126.4 and the number of days with a low of 0 or colder is 4. As for snow falls the average number of snow fall of 3” or more is 8 for 5” or more it is 3 and for 10” or more it is .5 so big time snow storms are rare here.
Now for some real fun. Is Grand Rapids getting warmer? On way to try and tell if a location is getting warmer or cooler is to look at the average mean temperature for each month. The “official” Climate Normals are a 30 year average mean that is updated ever ten years the current 30 years that are used are 1981 to 2010 the previous cycle was 1971 to 2000 and the next cycle with be 1991 to 2020. What I have done is looked up the average monthly mean temperature at Grand Rapids first set I used is the unofficial average means from 1963 to 1971 (I used 1963 as that is the year the current location was used) the next set I used was the official 1971 to 2000 cycle and next was the official 1981 to 2010 cycle (the currently used cycle use so when one says “average” or “normal” this is the one that is now used. I then used another “unofficial” mean average from 2010 to 2017. And just for a comparison I also use another “unofficial” average mean for a 100 year cycle from 1917 to 2017. Here is the results of my findings.
January
1917/2017 23.6° 1963/71 21.2° 1971/00 22.4° 1981/10 24.4° 2010/17 24.6°
February
1917/2017 23.6° 1963/71 22.6° 1971/0 25.0° 1981/10 26.8° 2010/17 25.3°
March
1917/2017 34.2° 1963/71 32.5° 1971/00 34.6° 1981/10 35.6° 2010/17 35.7°
April
1917/2017 46.5° 1963/71 46.0° 1971/00 46.3° 1981/10 48.0° 2010/17 48.3°
May
1971/2017 57.8° 1963/71 56.3° 1971/00 58.1° 1981/10 58.7° 2000/17 58.9°
June
1917/2017 67.7° 1963/71 67.6° 1971/00 67.1° 1981/10 68.4° 2000/17 69.5°
July
1917/2017 72.1° 1963/71 71.1° 1971/00 71.4° 1981/10 72.5° 2000/17 72.8°
August
1971/2017 70.3° 1963/71 68.7° 1971/00 69.4° 1981/10 70.8° 2000/17 70.2°
September
1917/2017 62.6° 1963/71 61.3° 1971/00 61.3° 1981/10 62.8° 2000/17 64.2°
October
1917/2017 51.2° 1963/71 51.9° 1971/00 49.9° 1981/10 51.0° 2000/17 51.6°
November
1917/2017 39.2° 1963/71 38.9° 1971/00 38.4° 1981/10 40.1° 2000/17 40.6°
December
1917/2017 28.3° 1963/71 27.4° 1971/00 27.6° 1981/10 29.2° 2000/17 29.9°
So is Grand Rapids getting warmer? Well ever month is now warmer (using the 1981/2010) vs the 1971/2000 mean averages. It is also now warmer then the 100 year average. Now lets look at the annual mean average for the period of 100 years 48.2° the annual mean average for 1963 the year the temperatures started to be taken at GRR to 1971 47.2° 1971/00 47.7° 1981/10 48.4° and in the 2010 to 2017 the mean annual average has been 49.9° So the case can be made that in the Grand Rapids area it has indeed gotten warmer over the last 100 years. More so in the colder winter months than the summer months. Note this is not to be taken as proof of warming on a much long term and what if any is the cause of this apparent warming
It should be noted that so far this year all months have been below average and June is well on the way to being the 6th month in a row below average. In fact so far this June has had just 2 days of 80 or better and that is the same number for the year so far. The least number of 80 or better days for a year here in Grand Rapids is 36 set in 1924.
Slim
Great post Slim!!
We are now almost at the half way point for June 2019 and here for Grand Rapids the official mean temperature so far this month is 63.6 that is a departure of -2.5° the average H/L so far has been 74.1/53.1 the normal average H/L is 76.8/55.4 The warmest it has been this month is just 82 and the coldest it has been is 40. And Grand Rapids has officially reported 2.21″ of rain fall so far.
Slim
The sun has now broken out and the temperature is now up to 72 here. Here at my house I have not had the AC on yet (have turned it on just to make sure it is working OK) Heck we have not had the windows open all that much let this year. I have had the furnace on for a short while just to take the chill off in the house.
Slim
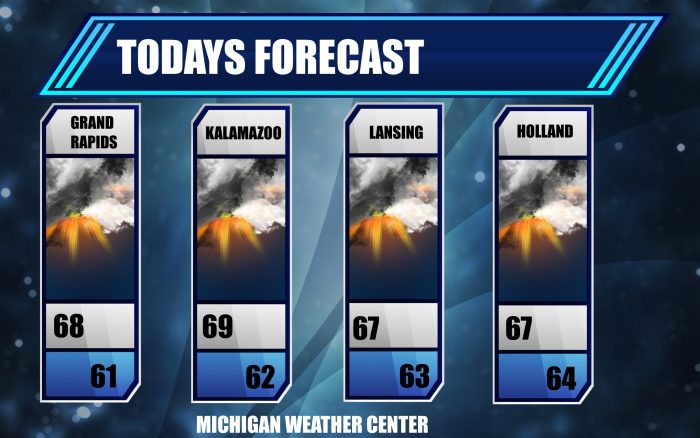
I am still working on different variations of the new weather forecast graphics – please bear with me. Today’s graphic is the feature image….
As Rocky would say just another below normal day in Michigan “keep the air conditioning running” lol…INDY!
I haven’t had the main air conditioner on yet – just the window unit in the bedroom at night…
MV yeaa We have not even put a fan in our window yet liking the new look on the weather page..INDY!
No ac for me yet, however the furnace has been on a couple times this month!!!!!
Great write up Slim! I haven’t been around 100 years, but growing up in the 70’s it sure seems warmer now than it did back then. Especially the way the past few years have trended, not just heat but also the humidity.
What? 6 months in a row with below normal temps! How is that possible, with all the warm weather hype we see on this blog? What a great cool pattern and let’s hope it lasts all year long!
I hope every one can find this post.
Slim
I added a feature image which brings the post into the main page post slider….