
Before I put up my winter forecast next month let’s take a look at the current CFSv2 forecast for this winter. This is the super long range model compared to the HRRR (High Resolution Rapid Refresh) which goes out to a few hours, the NAM (The North American Mesoscale Forecast System) which goes out four days and the GFS (The Global Forecast System) which is the long range going out to around 15 days.
One thing to keep in mind with long range models is that the further out they go time-wise the more the variables skew one way or the other. When long range models begin to start to come into agreement with the short range models there will be better agreement in what will actually happen.
The Climate Forecast System (CFS) is a model representing the global interaction between Earth’s oceans, land, and atmosphere. Produced by several dozen scientists under guidance from the National Centers for Environmental Prediction (NCEP), this model offers hourly data with a horizontal resolution down to one-half of a degree (approximately 56 km) around Earth for many variables. CFS uses the latest scientific approaches for taking in, or assimilating, observations from data sources including surface observations, upper air balloon observations, aircraft observations, and satellite observations.
The first set of graphics show the 2 meter (about 6.5 feet) temperature anomalies for December – January – February. The blues denote below normal temperatures and the yellows/oranges above. The forecast for November (not Shown) is calling for slightly above normal temperatures – we will see how this matches with the CPC when their monthly forecast comes out Thursday. The second set of graphics are the precipitation forecast for the same DJF time frame with the greens being above normal and yellows below normal.
[columns] [span4]
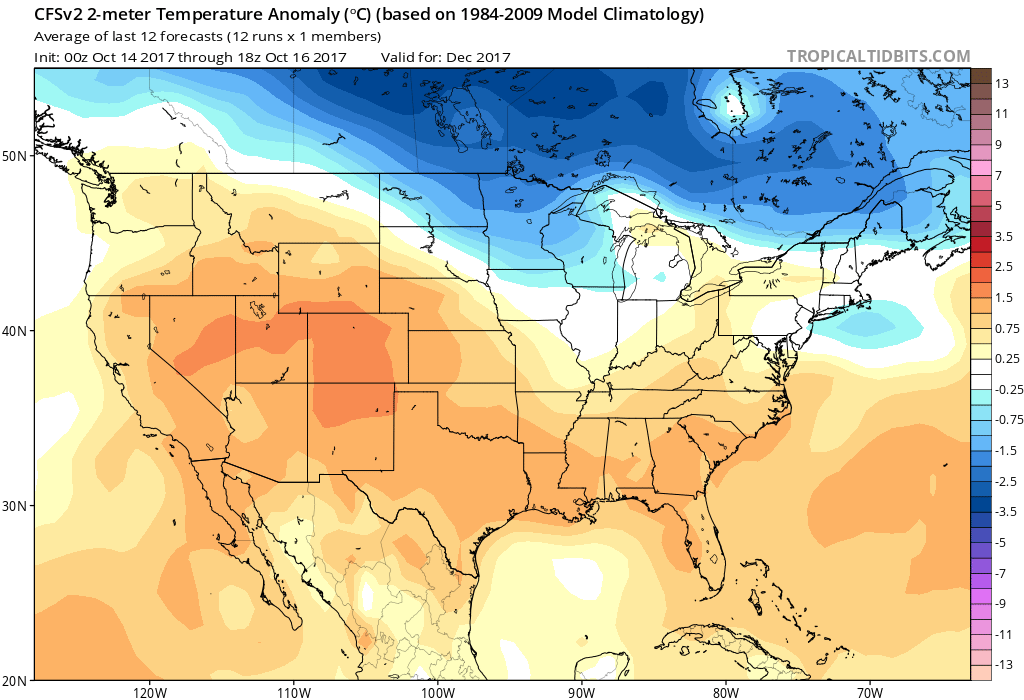
December Temperatures
[/span4][span4]
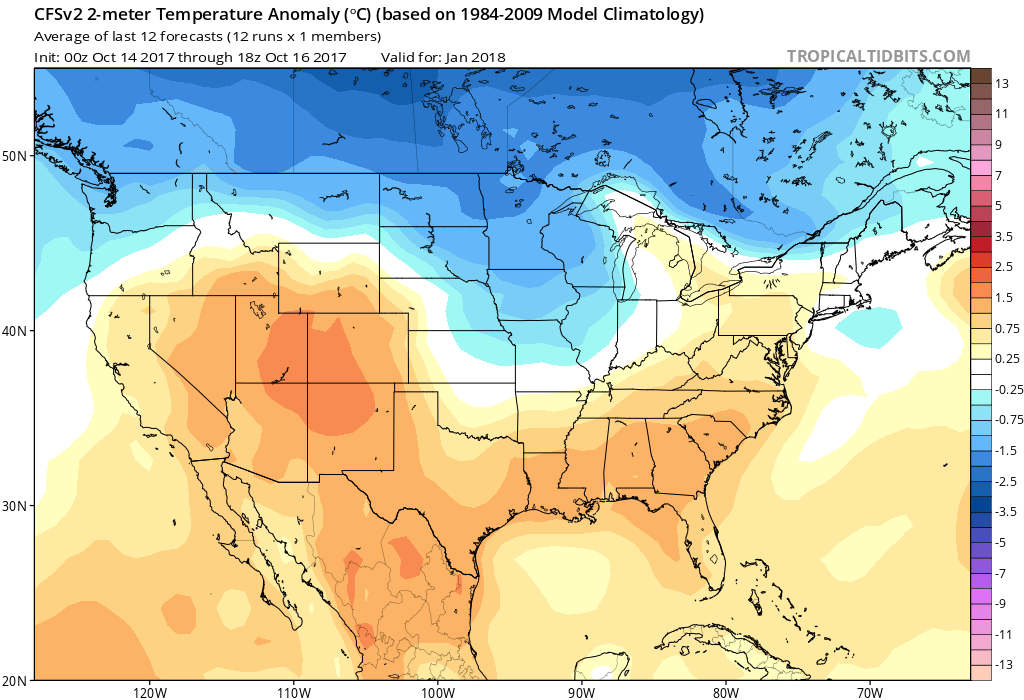
January Temperatures
[/span4][span4]
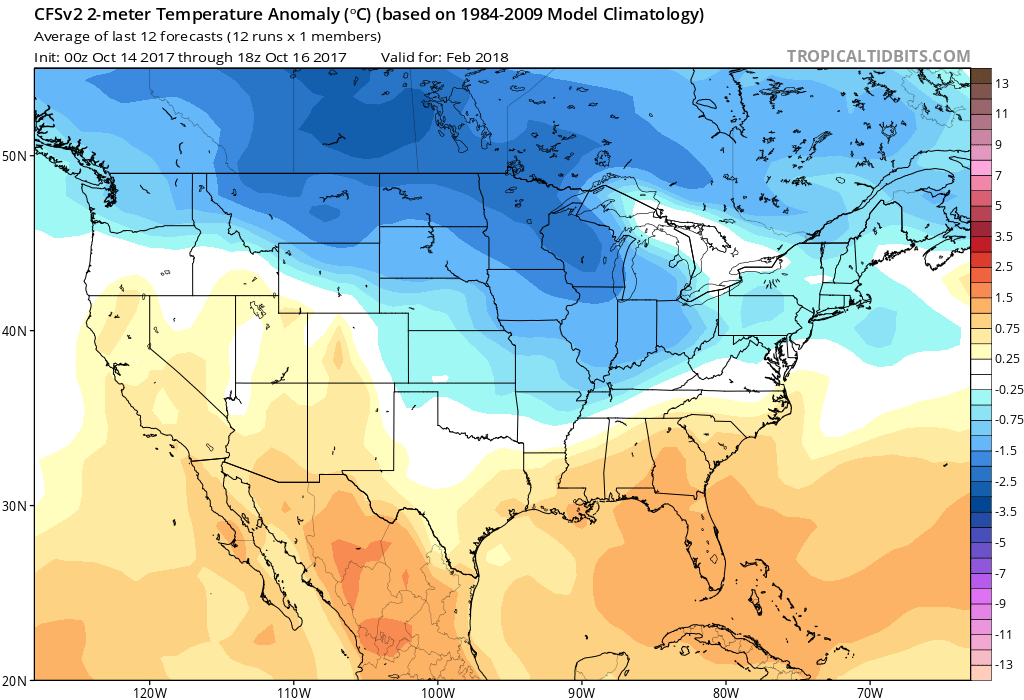
February Temperatures
[/span4][/columns]
[columns] [span4]
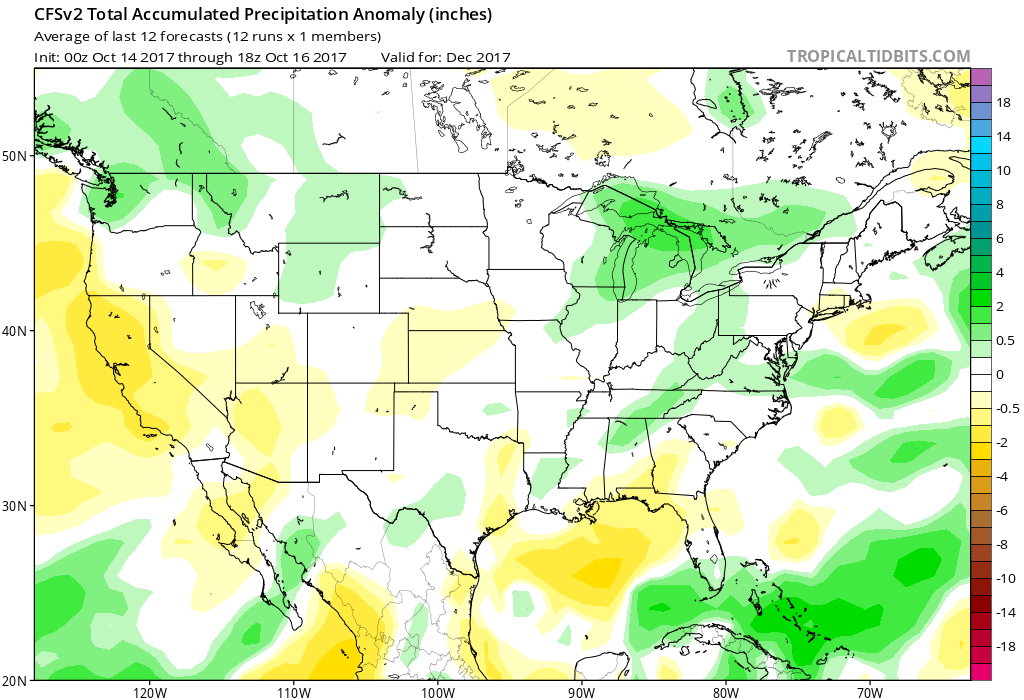
December Precip
[/span4][span4]
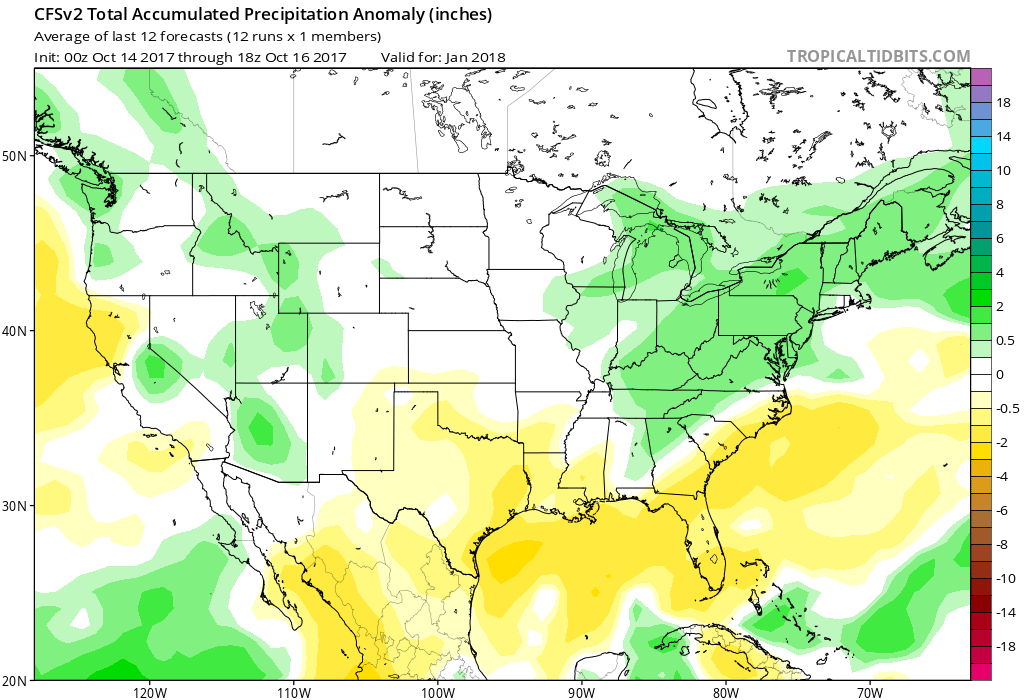
January Precip
[/span4][span4]
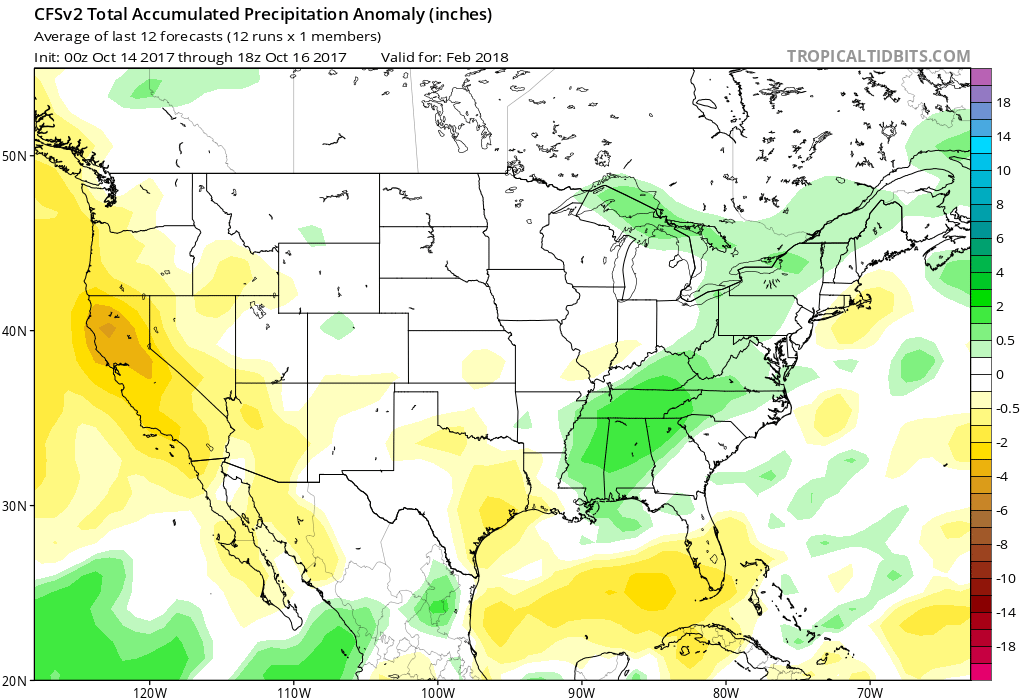
February Precip
[/span4][/columns]
Looking at these graphics one would think we would be seeing a cold snowy winter. Looking beyond the winter months the data from the CFS (not shown here) continues to show cool air around until early May.
This is the first of the forecast predictions I will post over the next few days before I come up with my own. There is a lot of data out there to try to consume and arrange into a legible forecast, many times ill spent due to the variation of what could happen and what will happen.
Just another perfect summer day! Longest summer I can recall this year.
Tomorrow I will look at the current conditions in the Northern Hemisphere and how it might relate to our winter forecast.
With 17 days into the October 2017 record books GRR with a mean October temperature of 60.2° (+6.8°) will have to see just how cold it gets towards the end of the month. Anyway, this should be the warmest October here since 2007. This October is still in the running for a top ten warmest (depending on how cold it gets at the end.
Slim
Those maps look a lot like the maps they put out the past couple years. We all know how they turned out.
You know the more one looks at “long range guesses” the more I believes that is just what they are a “guess” while one could justify the “guess” by putting educated in front of it and call it an “educated guess” it none the less just a guess.
Slim
This is why I am not a gambling man 🙂