A lot of stuff going on this morning as I try to cover it all in the fog of the attempt to change my biological clock with the time change. Won’t even try to get into a rant over that.
We had a high temp of 51° at 2 am (err I mean 1 am) and it has been falling since. We currently have 44° at 4:30 am with some sprinkles blowing in the wind.
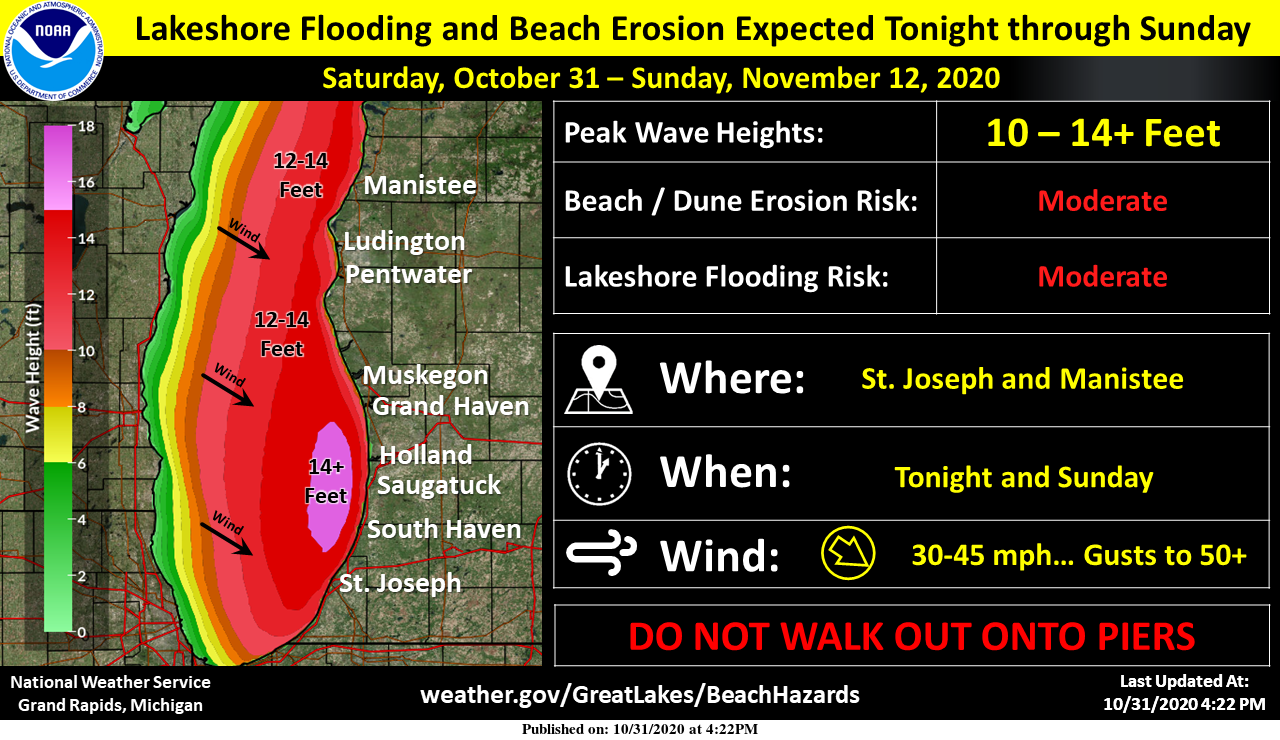
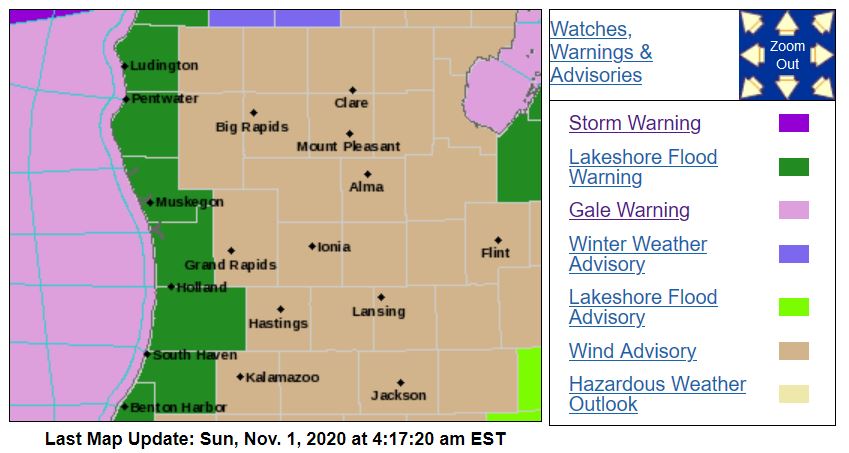
If you have any leaves left on the trees I am sure you will lose most if not all of them with the wind howling outside. We have lakeshore flood warnings and wind advisories in place this morning. Gale warnings for Lake Michigan and even winter weather advisories for northern Michigan. I think the areas to see the most snow will be around the Cadillac area even then the amounts will be quite meager.
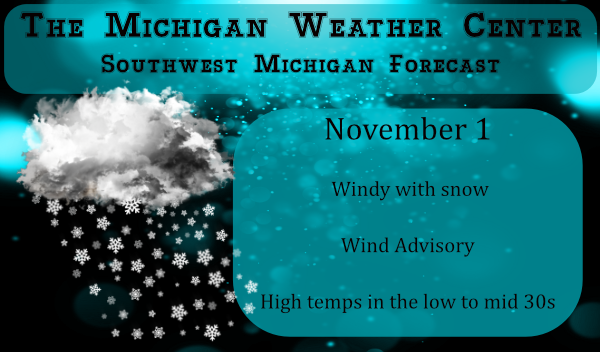
Falling temperatures, very windy conditions and snow showers are all expected today. Strong winds may cause power outages, especially along the Lakeshore. Brief bursts of heavy snow are also possible from late morning through evening, and may greatly restrict visibility for drivers, and potentially even cause a few slick spots on roads. Accumulations will be light.
Now for some weather education on La Nina. It should be pointed out that La Ninas are not all the same – it is dependent on the strength of the Nina and the Arctic and Atlantic Oscillations amongst other things. This is why it is so hard to put out a winter forecast let alone a forecast for two weeks out or less.
La Nina refers to the periodic cooling of ocean surface temperatures in the central and east-central equatorial Pacific. Typically, La Nina events occur every 3 to 5 years or so, but on occasion can occur over successive years. La Nina represents the cool phase of the El Nino/Southern Oscillation (ENSO) cycle.
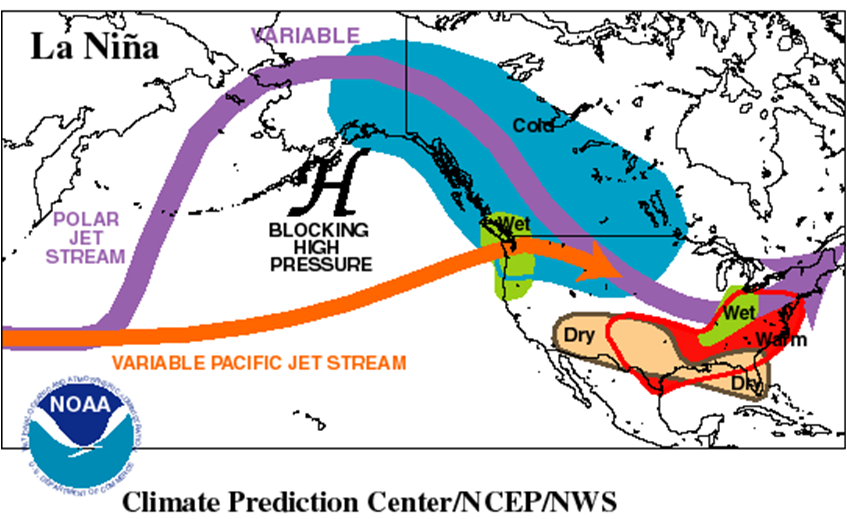
During a La Nina event, the changes in Pacific Ocean temperatures affect the patterns of tropical rainfall from Indonesia to the west coast of South America. These changes in tropical rainfall patterns affect weather patterns throughout the world. These effects are usually strongest during the winter months when the jet stream is strongest over the United States. As shown in the image below, La Nina episodes in the winter months feature a wave-like jet stream flow across the United States and Canada, which causes colder and stormier than average conditions across the North, and warmer and less stormier conditions across the south. Historically for this part of the Midwest, fall tends to be warmer and drier than normal while winters tend to be wetter than normal. However, there are also many other complicated factors in the atmosphere and oceans that can also impact our weather patterns.
The AO is a reference to changing atmospheric pressure patterns in the high latitudes of the Arctic region. When there is relatively high pressure over the northern polar region and relatively low pressure in the middle latitudes, the AO is considered to be in a negative phase. When this pattern is reversed, it is known to be in a positive phase. During the negative phase, cold air generally plunges southward into the central and eastern United States as the jetstream buckles and high pressure over the polar region helps push the very cold polar air southward. In the positive phase, the winds associated with the polar jet stream are generally zonal and confined to the northern latitudes. This essentially “bottles up” the very cold air in the polar regions. The AO phases can be seen in the diagram below. Additional information on the AO can be found at http://www.cpc.ncep.noaa.gov/products/precip/CWlink/daily_ao_index/ao.shtml .
 |
The NAO is similar to the AO, but is a measure of the difference in atmospheric sea level pressure between the Icelandic low (also known as the polar low) and the Azores high (also known as the subtropical high). The positive phase of the NAO indicates a stronger than normal Azores high and a stronger than normal Icelandic low. This results in an increased pressure gradient between the two. The negative phase of the NAO indicates a weaker Azores high and weaker Icelandic low, which results in a weaker pressure gradient between the two pressure centers. The positive phase is generally associated with above average temperatures in the eastern CONUS while the negative phase is associated with below average temperatures. The NAO phases can be seen in the diagram below. Additional information on the NAO can be found here
 |
While the AO and NAO have been shown to have significant impacts on the weather across the CONUS, they can only be forecast with reasonable skill out to about two weeks. Therefore, while La Nina is a persistent, relatively long term pattern, the AO and NAO fluctuations are on a much smaller time scale and their effects can enhance or suppress conditions typically associated with a La Nina. When the AO and NAO are in their negative phases, they can provide cold air across the CONUS. If these phases coincide with a strong storm system generated in a La Nina pattern, a significant snow storm could be the result. However, if the AO and NAO are in a positive phase when a storm system develops, there could be less cold air and potentially more liquid precipitation. These complicated interactions are just a small part of what makes forecasting winter weather in the central and eastern United States so difficult.
We have an AWESOME weather day on tap? It is great to see snow!
Getting light snow out at thee YARDofBRICKS NE of GR beautiful at best have a super Sunday ….INDY
For better or worse welcome to November. October 2020 at Grand Rapids had a mean temperature of 47.8 that was a departure of -3.2. The high for the month was 79 on the 9th and the low was 25 on the 31st there was a trace of reported snow fall. This was the coldest October since 2006. At Muskegon they had a mean of 49.9 that was a departure there of -0.8 the highest was 75 on the 9th and the low was 29 on the 31st. and they also reported a trace of snow fall. At Holland they had… Read more »
Very cold month we just felt thanks for the facts Slim …INDY
Just another typical below normal temp month! We are a cool pattern for sure! Let’s keep it rocking and rolling!
Good information on La Nina.
Slim
Wow, that’s a pile of info MV! We’re you up all night?
Good place to watch the waves at Holland State park with the link below. Just scroll down till you see the state park webcam. And it’s a lot safer than being there!
https://www.cityofholland.com/645/MIHollandCAM
This is a great link. I’ve watched it before. You are right it is safer than being there.