There is an increasing chance (~55-60%) of La Niña during the Northern Hemisphere fall and winter 2017-18. A watch is issued when conditions are favorable for the development of El Niño or La Niña conditions within the next six months.
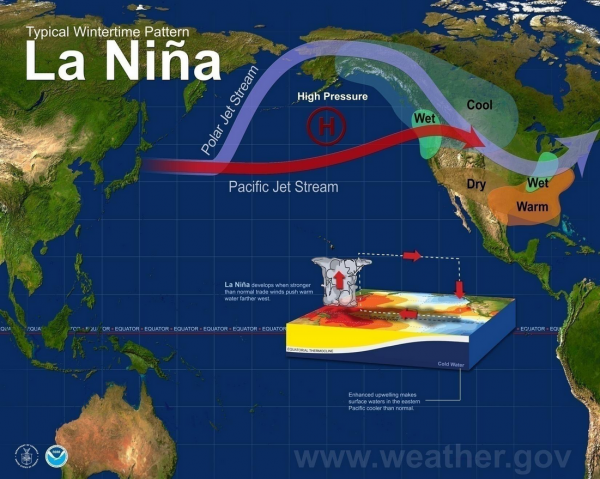
The arrival of El Niño or La Niña in the tropical Pacific Ocean triggers a cascade of changes in tropical rainfall and wind patterns that echo around the globe. For the United States, the most significant impact is a shift in the path of the mid-latitude jet streams. These swift, high-level winds play a major role in separating warm and cool air masses and steering storms from the Pacific across the U.S.
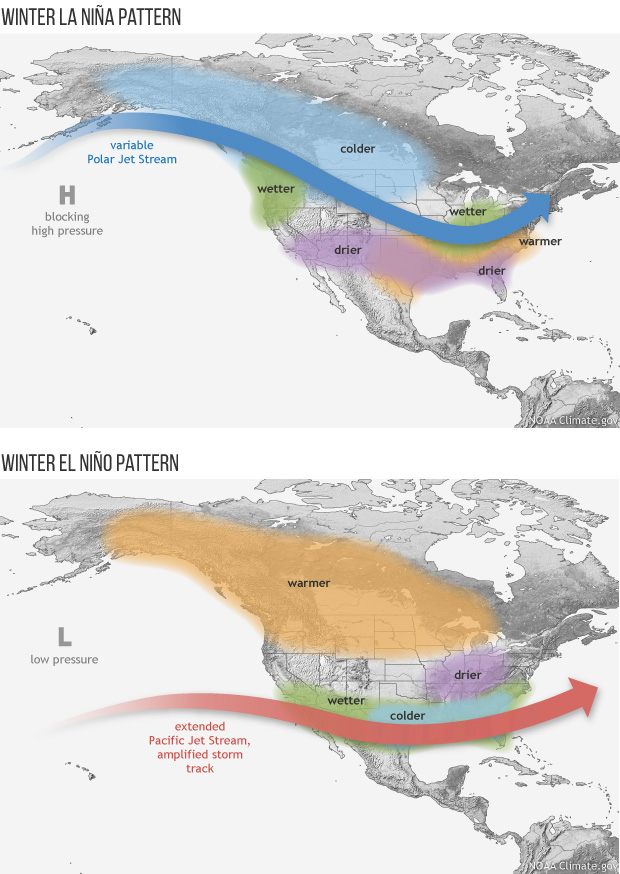
These maps illustrate the typical impacts of El Niño and La Niña on U.S. winter weather. During La Niña, the Pacific jet stream often meanders high into the North Pacific and and is less reliable across the southern tier of the United States. Southern and interior Alaska and the Pacific Northwest tend to be cooler and wetter than average, and the southern tier of U.S. states—from California to the Carolinas—tends to be warmer and drier than average. Farther north, the Ohio and Upper Mississippi River Valleys may be wetter than usual. During El Niño, these deviations from the average are approximately (but not exactly) reversed.
One or more of these climate patterns have occurred during many El Niño and La Niña events in the past. That doesn’t mean that all of these impacts happen during every episode. Every event is somewhat different. In other words, the influence of El Niño on U.S. winter climate is a matter of probability, not certainty.
El Niño and La Niña are opposite phases of a natural climate pattern across the tropical Pacific Ocean that swings back and forth every 3-7 years on average. El Niño and La Niña alternately warm and cool large areas of the tropical Pacific—the world’s largest ocean—which significantly influences where and how much it rains there.
Like a boulder dropped into a stream, this shift in the location of tropical rainfall disrupts the atmospheric circulation patterns that connect the tropics with the middle latitudes, which in turn modifies the mid-latitude jet streams. By modifying the jet streams, El Niño and La Niña can affect temperature and precipitation across the United States and other parts of the world. The influence on the U.S. is strongest during the winter (December-February), but it may linger into early spring.
Currently the sea surface temperature in our favorite Niño3.4 region in the central Pacific was about 0.1°C colder than the long-term average over June – August, smack-dab in the neutral range. The atmosphere also reflected neutral conditions during the summer, with the winds above the equatorial Pacific neither particularly enhanced nor weakened, and an average pattern in the clouds and rainfall.
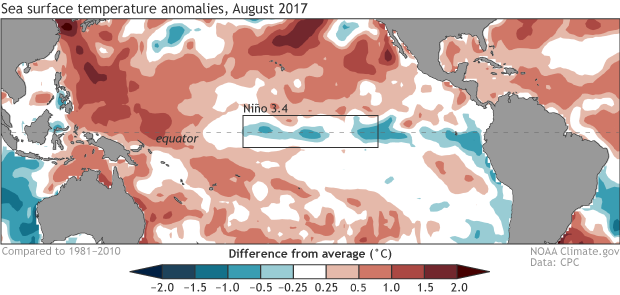 While neutral prevailed during meteorological summer (what we call June – August, while the summer solstice through the vernal equinox is “astronomical summer”), we began to see some indications over the course of August that a change may be afoot. The first of these is the downward trend in central Pacific sea surface temperature anomalies (departure from the long-term mean) from July into August, with the August average in the Nino3.4 region of about -0.4°C, using ERSSTv4 data.
One of the many environmental factors that we monitor closely is the temperature of the tropical Pacific below the surface of the ocean. Over the course of a couple of months, areas of cooler or warmer water can grow or move below the surface of the Pacific from west to east along the equator. These blobs (often in the form of oceanic Kelvin waves) often rise to the surface as they approach the eastern Pacific Ocean, and so give us a heads-up of how the surface may look in the near future.
It just so happens that during August, an area of cooler-than-average water developed around 50-150 meters (~160-500 feet) below the surface of the Pacific.
Subsurface Kelvin waves are triggered by changes in the wind at the surface. The trade winds normally blow from east to west across the surface of the equatorial Pacific, keeping warmer surface water trapped in the western Pacific Ocean. If the winds weaken or strengthen, they can sometimes—but not always; this is a complex system—kick off Kelvin waves. In the case of an upwelling Kelvin wave, such as what we saw over the last month, the winds across the equatorial Pacific have strengthened, pushing harder on the surface waters and allowing cooler water to upwell from the deep ocean.
Since fall of 2016, the overall wind pattern has tended toward slightly stronger-than-average trade winds in the central and western Pacific, with a brief interruption in April 2017. This pattern is a little La Niña-ish, despite a lack of cool sea surface waters, and it’s one of the reasons we didn’t have a lot of confidence this past spring in the climate model forecasts for El Niño.
During the second half of July, the trade winds puffed a bit harder over the western half of the Pacific, likely helping this current Kelvin wave form. The complexity of the ocean-atmosphere system, where changes in one feed back into the other, means it’s difficult to diagnose a “cause” of the strengthened trade winds.
Where does this leave us in regards to our winter forecast? It is to early for me to speculate on that issue at this time. The CPC long range guesses for December, January, February are showing a normal temperature outlook with above normal precipitation which would tell me their model guidance may be figuring in the possibility of an La Nina Winter. Personally I am not so sure of this but we will have a better idea coming into October and November to see if we can break out of this long term warm spell. Keep in mind the EC on the maps mean ‘equal chances‘.
The term chance by definition means the occurrence and development of events in the absence of any obvious design or a possibility of something happening. This means nothing is written in stone….
[columns] [span6]
[/span6][span6]
[/span6][/columns]
Mv- thanks for changing my avatar. Looks much better. 🙂
It is a beautiful Fall day out there!!
This September will be the 3rd September in a row with will above average temperatures and will be one of the top ten warmest in Grand Rapids history.
Slim
Bullseye again for next week!
http://www.cpc.noaa.gov/products/predictions/610day/610temp.new.gif
Just when I thought we were done with 80s.
WOOD now has 83, 84 next week. The hot summer weather just won’t quit.
As Michael stated we have what looks like a possible central La Nina developing for this winter. For those who believe in analog years as a long-range guess here are some past years that had a similar set up as this winter could. The list is long and only goes back to 1950. Remember no two winters are alike and that includes the winters on this list. 1950, 1954, 1956, 1962, 1964, 1967, 1970, 1974, 1983, 1988, 1995, 2000, 2005, 2007, and 2011. I am sure if you look at each winter some would find a winter of your liking… Read more »
If anything, this will be a late starting and weak La Nina. I don’t see a lot of reason to base a winter prediction merely off of it.
The Farmer’s Almanac has all of Michigan having a mild winter with higher than average lake effect. With the warm water temps, this seems like a good bet for now.
The warm waters of the Lakes should keep this area warmer well into the fall season. It could be cloudier as well and that could delay the first killing frost as well. As for the winter season it is still too early to say how that will play out. One item of note is that Grand Rapids has not had a official low of below zero since February 2015. Why is that a big deal? In Grand Rapids recorded weather history GR has only had two other times when there were two or more winters in a row without a… Read more »